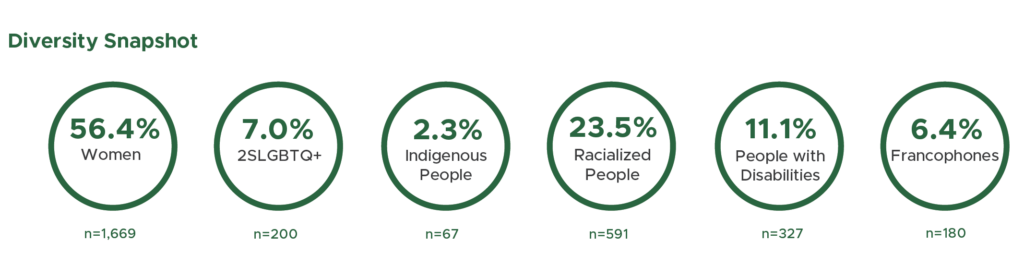
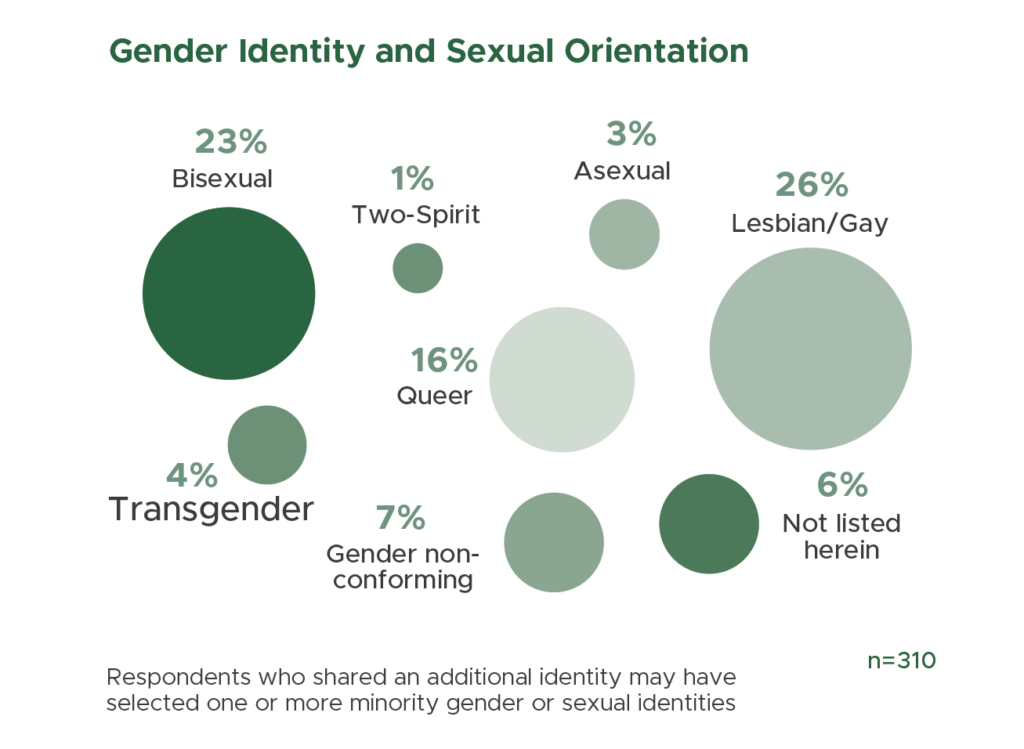
2SLGBTQ+: a person who does not identify as cisgender and/or heterosexual (these may include but are not limited to people who identify as gay, lesbian, bi-sexual, two-spirited, queer, trans-gender, gender fluid, nonbinary, etc.) The terminology used is not meant to label individuals but rather to be helpful functional descriptors. They are not standardized and may be used differently by different people and is deeply personal.
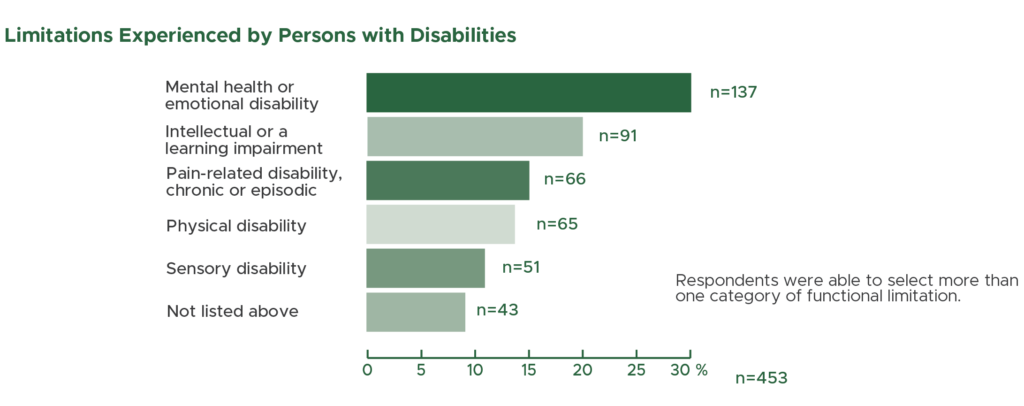
Disability: Persons with Disabilities are persons who have a long-term or recurring physical, mental, sensory, psychiatric or learning impairment who,
a) consider themselves to be disadvantaged in employment because of that impairment, or b) believe that an employer or potential employer is likely to consider them to be disadvantaged in employment by reason of that impairment, and includes persons whose functional limitations owing to their impairment have been accommodated in their current job or workplace.
Francophone: a person who belongs to a population using French as its first or sometimes second language. In the OPSEU Academic Collective Agreement, Francophones are identified as an equity deserving group.
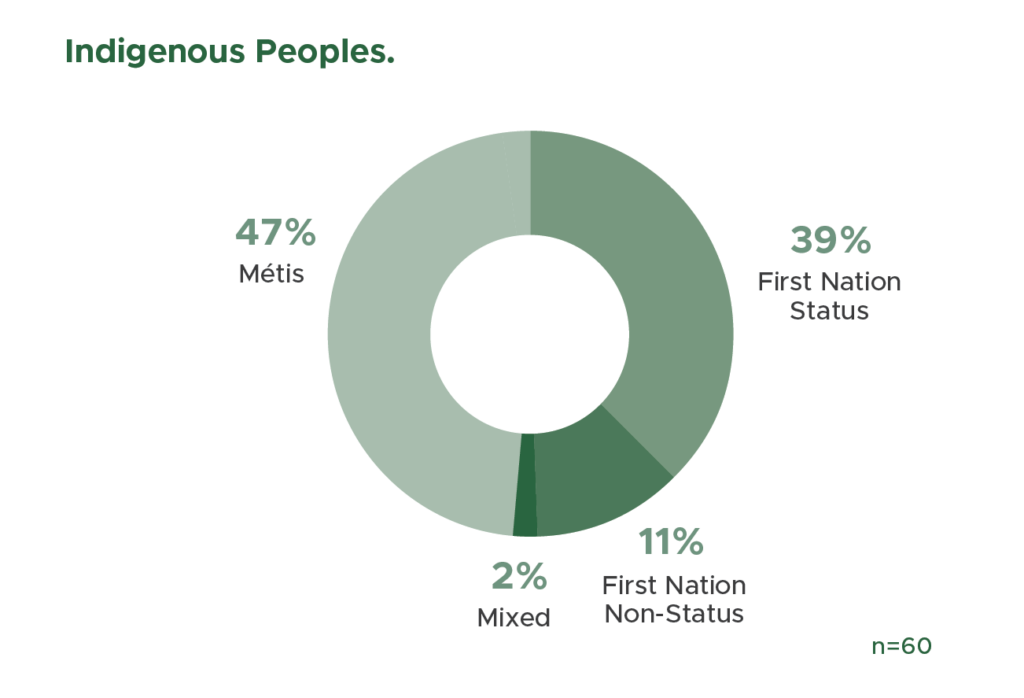
Indigenous Peoples: Indigenous (Aboriginal) people are persons who are First Nations, Inuit or Métis, Status or Non-Status.
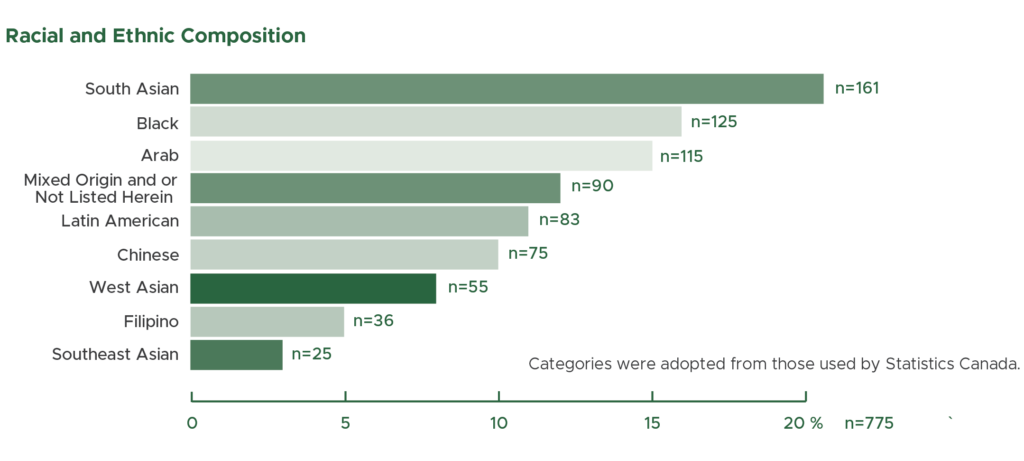
Members of racialized minorities (visible minorities): means persons, other than Indigenous (Aboriginal) peoples, who are non-Caucasian in race or non-white in colour. A person may be a member of a racialized (visible minority) group regardless of their place of birth or citizenship.
Women: a designated group under the Employment Equity Act. The Act does not define the term ‘woman’ and neither do we.